It always seemed to me the week after Labor Day was more than the end of the summer here in the US. It was the time of the year when we had to get serious about forecasting full-year performance and start planning in earnest for the next year. I’ll bet some of you are working on your spreadsheets right now.
Let’s look at some publicly traded AH company performance metrics over the last 12 months (TTM) to help estimate what industry growth looks like this year and next. In this table are revenue growth rates and as an indicator of spending, SG&A expenses. These are as reported numbers, so the effects of exchange are not considered.
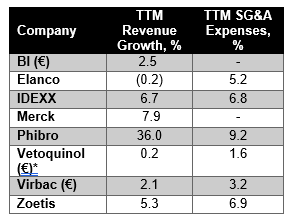
As our Industry Overview attendees know, we estimated currency corrected growth in 2024 at 6.7% and that the 10-year CAGR is 5.8%. If you consider the devaluation of the USD this year, which will likely cost about 2 points of total USD industry growth, it looks like another typical year in 2025 for industry revenue growth. Interestingly, where we have data, SG&A expense growth is higher than revenue growth in each company. Keep working on those spreadsheets.
Bob Jones